Graphic user interface (GUI)
GUI overview
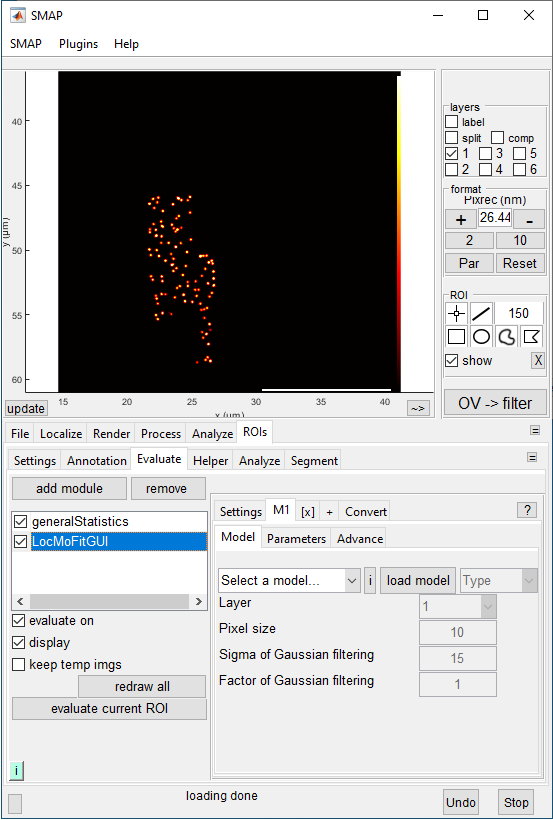
LocMoFit is integrated into SMAP. You can follow the steps to access to LocMoFit in SMAP:
Go to the [ROIs] tab.
Go to [Evaluate] tab and click add module.
In the popup window, select LocMoFitGUI and click ok.
Now the SMAP window should look like the image above. There are three main tabs in the LocMoFit GUI: [Settings],[M1], and [Convert] and a button [+].
Note
The button [+] here allows you to add one more model.
Here I will introduce them in the order of a routine workflow.
Tab [M1]: Model 1
This is the first tab you will see once the module LocMoFitGUI is added. In this tab, you can load and set up the first SMLM model.
Sub-tab [Model]
a button load model allows you to load a SMLM model.
a pop-up menu Type allows you to specify the model type. You can find out more about the model types here.
a pop-up menu Layer allows you to define which layer this model will be fitted to.
a field Pixel size for you to define the pixel size. This only applies to an image or continuous model.
a field Sigma of Gaussian filtering where you can specify a constant sigma of Gaussian filtering. The higher the more blurred.
a field Factor of Gaussian filtering where you can specify the factor of Gaussian filtering. The higher the more blurred.
Note
Sigma of Gaussian filtering and Factor of Gaussian filtering exclude each other.
Sub-tab [Parameters]
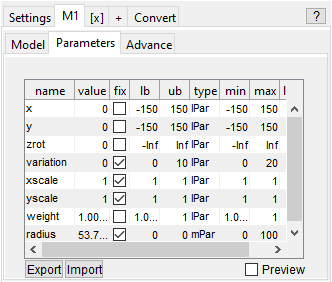
If you already loaded a model, you can move on to this tab and set up the model parameters. Here you will see the following:
the main table where you can set up the model parameters. See parameter table for more details.
buttons Save and Load allow you to save and load settings.
a button Pick site allows you to click a site in the ROI manager without evaluating the fit. This is usually used together with the button Preview
a button Preview to show the model with the initial parameters.
Description of the fields
name: parameter names.
value: initial values of parameters.
fix: specify the parameter should be fix or or not. If checked, the parameter will be set to the value you defined and will be a constant that are not fitted.
lb: relative lower boundaries of parameter ranges.
ub: relative upper boundaries of parameter ranges.
type: types of parameters. This is not editable.
min: absolute lower boundaries of parameter ranges.
max: absolute upper boundaries of parameter ranges.
label: user-defined labels for the corresponding parameters.
Note
For example, value 30, lb -10, ub 20, min 10, and max 45 results to a parameter range of [20 45]. This is based on first get [value+lb value+ub] = [20 50], and then check whether this is beyond [min max] = [10 45] or not. If this is the case, the range will be set to the min or max values so the final upper boundary is 45 but not 50.
Sub-tab [Advance]
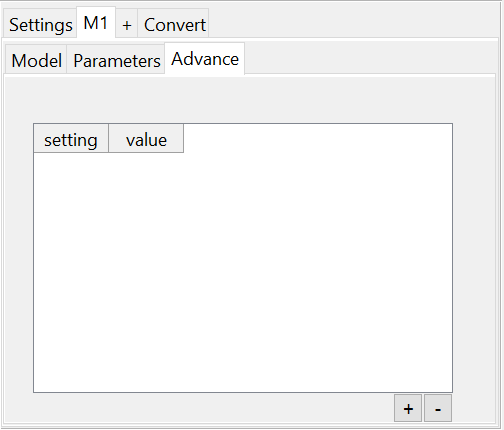
You can set up the advanced settings here. The setting items are model-specific. Here you will see the following:
the main table where you can set up the advanced settings. You can choose a setting item that you want to modify in the column Setting and define its value in the column Value.
buttons + and - allows you to add/remove a setting item.
Note
You can click the button [+] next to the tab label [M1] to add one more model as [M2].
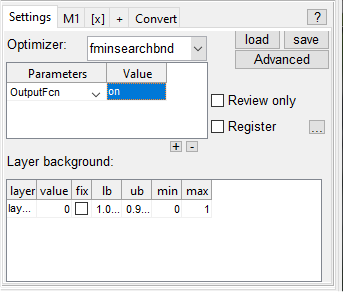
Tab [Settings]

In this tab, you can set up settings beyond specific models and have a global control of the current LocMoFitGUI instance. Here you will see the following:
a pop-up menu Optimizer allows you to define which optimizer to use.
a table of optimizer parameters and buttons + and -. Here you can define parameters of the optimizer. Use +/- to add or remove a parameter.
buttons load and save allow you to load and save the entire settings.
a button advanced for advanced settings. Usually you don’t have to touch this part. If you click it, you will get a list of advanced settings in a new pop-up window.
a checkbox Review only. Check it if you have fitted the current site and just want to review the fit.
a checkbox Transform. Check it if you would like to transform the site based on the model with the final parameter estimates.
a table of Layer background. This is similar to a general parameter table.
Tab [Convert]
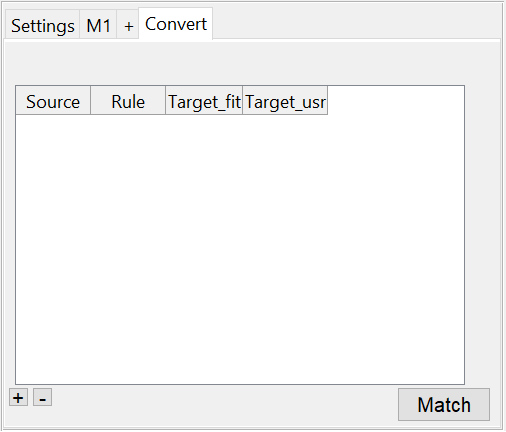
Instead of constants, you can define initial parameters with user-defined rules here. Here you will see the following:
the main table where you can set up the rules for converting them to parameter values. The meanings of the columns:
Source: source LocMoFitGUI instance/step.
Rule: rules for defining the target.
Target_fit: target parameters in the fit.
Target_usr: target temporal user-defined variables.
buttons + and - allow you to add or remove a rule.
a button Match for matching the parameters with the same names from a previous step. These define the value of matched ones based on the final estimates of the previous step.
Note
If you defined a conversion rule here for a parameter, the initial value of the parameter defined in the sub-tab [Mxx]/[Parameters] will be ignored.
Fit viewer
After the current site is fitted, the fit viewer will show if the display is checked. This viewer is different per model type and data dimension.
For 3D continuous/discrete models
You should see this window show up:
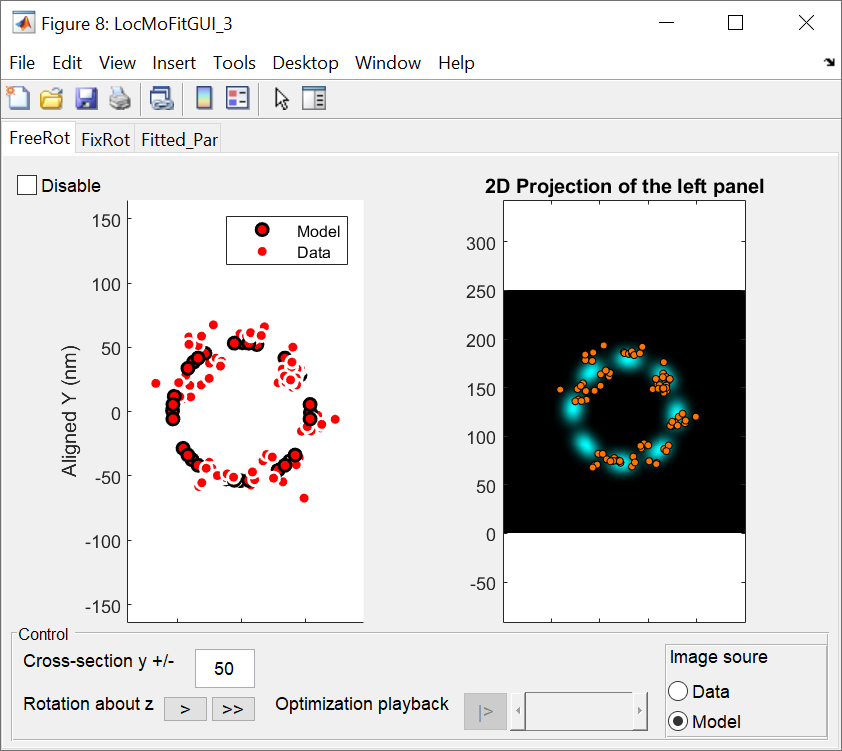
Tab [FreeRot]
Here you will see the following:
a checkbox Disable. For efficiency, you can check it so that the plots will not be drawn.
the left panel Dot plot. Here both the model and the data are represented by dots.
the right panel 2D Projection of the left panel. Here either the model or the data is rendered as a image. You can specify the image source bellow in the panel Control.
the bottom panel Control. Here you can:
define the thickness of the cross-section along the y-axis.
rotate the site about z-axis with the buttons > and >> in small and large steps, respectively.
You can playback the process of optimization if its history is saved.
Note
You can enable the history saving by turning on the OutputFun in the table optimizer parameters
Tab [FixRot]
Note
By default, this tab is disabled. You can uncheck the checkbox Disable to show the content.
a checkbox Disable. For efficiency, you can check it so that the plots will not be drawn.
four panels of the fitted site with different rotation angles around the z-axis.
Tab [Fitted_Par]
Note
For each viewer, it comes with a tab [Fitted_Par] regardless of the model type:
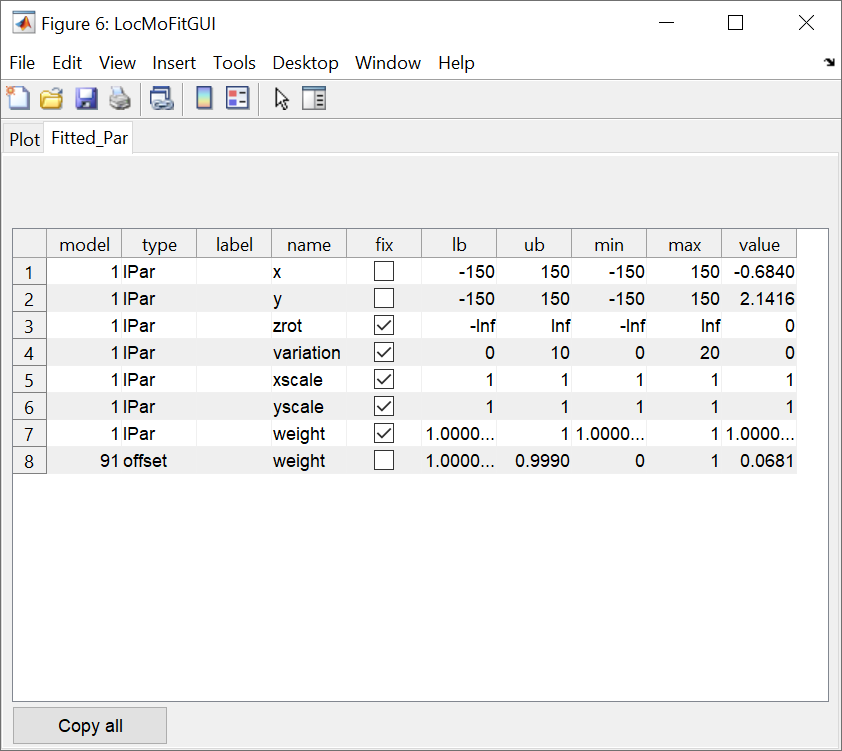
the main table that displays the parameter settings with parameter estimates shown in the column Value.
a button Copy all allows you to copy the entire table to the clipboard.
For 3D image models
You should see this window show up:
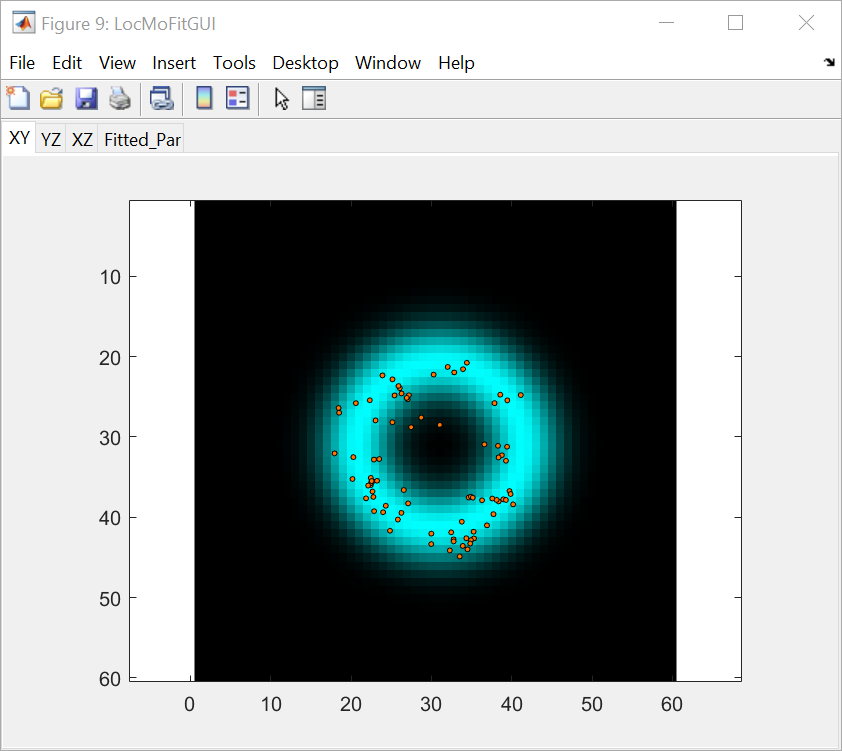
There are three projection tabs showing the site in different views (planes [XY], [YZ], and [XZ]) and the common tab [Fitted_Par].
For 2D models
You should see this window show up:
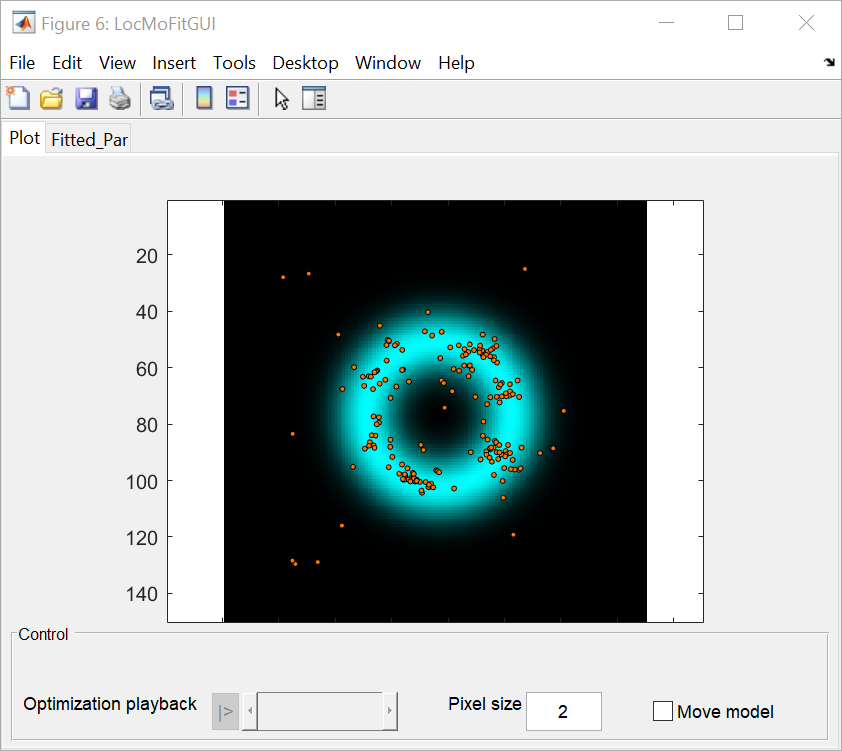
There are two tabs:
[Plot] showing the data as points and the model as an image. In the control panel:
you can playback the process of optimization if its history is saved.
you can define the pxiel size for rendered image above.
normally the data is transforemd. You can transform the model instead by checking the checkbox Move model.
the common tab [Fitted_Par].